Dashboards have become the default way companies monitor their data. Every team has them. Every metric is visualized. Yet incidents still arrive without warning, revenue drops are noticed too late, and operational problems surface only after they have already caused damage. The issue is not a lack of data or tooling. It is a false sense of visibility.
Dashboards are designed to show what already happened. They summarize historical values and present them in a form that requires human interpretation. Someone has to be looking at the right chart at the right moment and notice that something looks off. In modern systems, where dozens of metrics move constantly, this assumption does not hold.
Most anomalies start quietly. A conversion rate drops slightly overnight. Payment failures increase only in one country. A data pipeline begins to lag, slowly skewing downstream metrics. Each change looks normal on its own. Dashboards are not built to judge whether a change is abnormal or whether several small changes together signal a real issue.
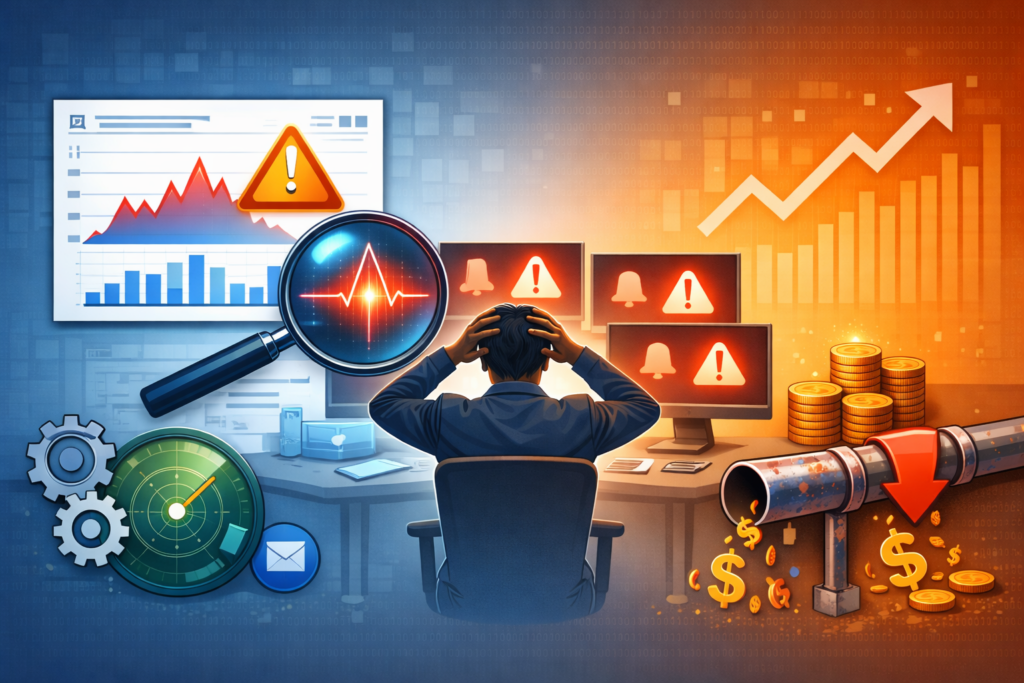
A common real-world scenario looks like this. A mid-size SaaS company notices a revenue dip at the end of the month. The dashboard shows the problem clearly, but only in hindsight. After investigation, the team discovers that three weeks earlier a small increase in checkout failures began in one region after a backend change. The metric was visible the entire time, but the change was too small to trigger concern. No alert fired. No one was watching that specific chart daily. By the time the issue became obvious, thousands of failed transactions had already occurred.
This is how most costly incidents happen. Not as sudden crashes, but as slow drifts that stay below human attention thresholds.
The cost of missed anomalies is rarely dramatic in the moment. It accumulates quietly. Revenue leaks continue unnoticed. Incident response becomes reactive instead of preventative. Analysts spend time explaining what went wrong instead of preventing it. Over time, trust in data erodes because insights arrive too late to change outcomes.
Many teams attempt to solve this with threshold-based alerts layered on top of dashboards. This usually makes things worse. Static thresholds do not adapt to seasonality, growth, or behavioral change. Normal fluctuations generate false positives. Real issues slip through when systems evolve. Alerts get ignored, muted, or endlessly tuned until they lose credibility.
Dashboards can answer what the current value of a metric is. They cannot answer whether a change is abnormal, whether it matters now, or whether it is part of a broader pattern across metrics. Those questions require continuous analysis, not visual inspection.
Anomaly detection addresses this gap. It focuses on changes over time, not static values. It evaluates behavior in context and surfaces early signals that humans are unlikely to catch. It operates continuously, filling the blind spots between reporting cycles where most damage originates.
Dashboards still have a role. They are excellent for exploration and explanation. But they are not a reliable early warning system. Teams that rely on dashboards alone will always discover problems late, not because they are careless, but because humans are not designed to monitor complex systems in real time.
The difference between reacting and preventing often comes down to whether anomalies are detected early or only seen in hindsight. Dashboards tell you what happened. Anomaly detection tells you when something starts going wrong.
A practical next step for CTOs, Data, and Ops teams
If you are responsible for reliability, data quality, or business-critical metrics, ask one simple question:
Which metric failure would hurt you most if you discovered it two weeks late?
If the honest answer is “we would only notice it in a report,” you already have a detection gap.
A lightweight next step is to run a short anomaly review on your existing metrics. No migration. No rebuild. Just validate whether early signals are currently being missed.
If you want to sanity-check this for your stack, a 5-minute fit check is usually enough to tell whether automated anomaly detection would have caught your last incident.
That clarity alone is often worth it.