
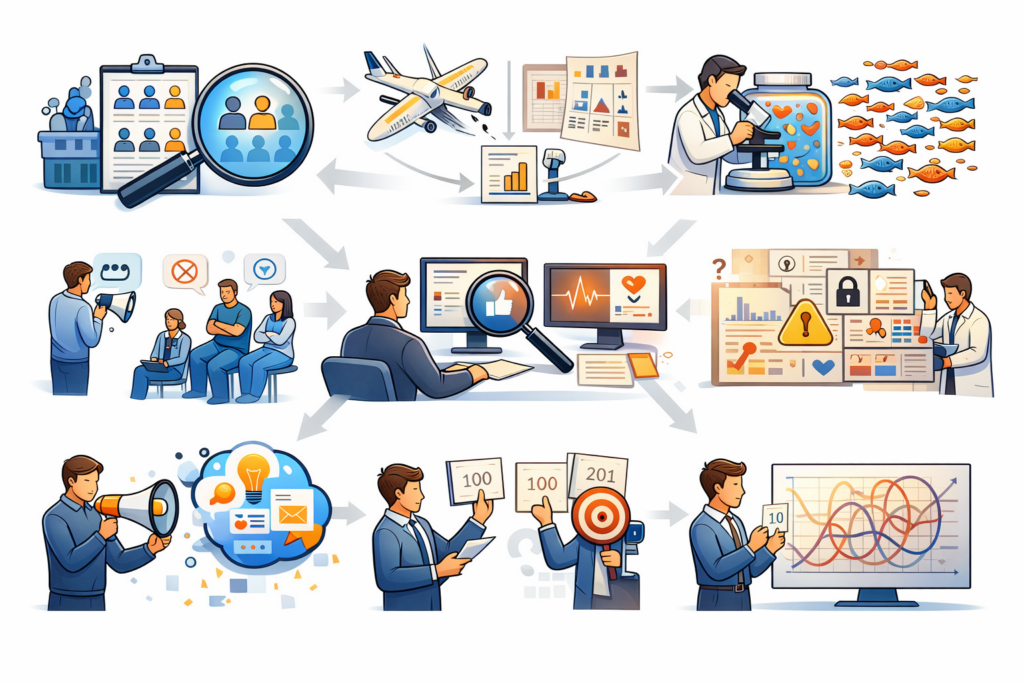
Social Comparison Bias occurs when individuals evaluate themselves based on comparisons with others, feeling either superior or inferior depending on relative performance. In a data context, this bias influences how teams interpret metrics, dashboards, and analytics outcomes.
In BI and analytics projects, the bias often emerges when teams compare their KPIs with competitors, peer departments, or industry benchmarks without context. A team may overestimate their performance because their numbers look better than another group’s, or conversely, undervalue their impact when metrics appear worse. This can distort priorities, lead to reactive decision-making, or create unnecessary internal competition that distracts from business objectives.
The consequences are subtle but significant. Decisions driven by relative perception rather than absolute performance may prioritize optics over actionable insights. For instance, focusing on metrics that make a team look good externally can reduce attention to areas critical for long-term business outcomes. Social Comparison Bias can also discourage experimentation, as teams fear failing relative to peers.
To detect this bias, observe whether decisions shift primarily due to peer comparisons rather than data trends, and gather feedback on whether metrics are interpreted in context. Surveys or workshops can reveal team members’ tendencies to overemphasize relative performance.
Mitigation involves emphasizing objective, contextualized metrics, framing dashboards around organizational goals rather than peer ranking, and fostering a culture that values learning from data over comparison. Encouraging cross-functional discussion about why metrics behave as they do, rather than who looks better, can reduce its impact.
Recognizing Social Comparison Bias helps teams make decisions based on real insights, not perceptions skewed by relative standing. Awareness and structured interpretation improve focus on what truly drives value.